Ribbon of Chart Tools
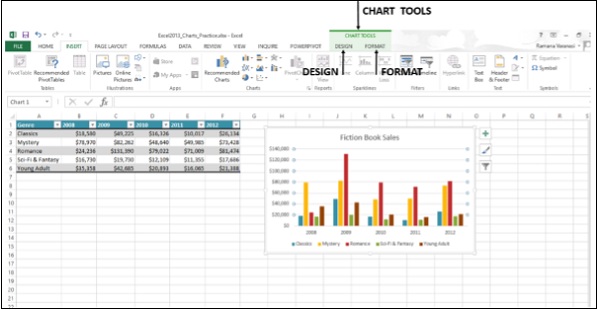
When you click on your Chart, the CHART TOOLS tab, comprising of the DESIGN and FORMAT tabs is introduced on the ribbon.
Step 1 − Click on the Chart. CHART TOOLS with the DESIGN and FORMAT tabs will be displayed on the ribbon.
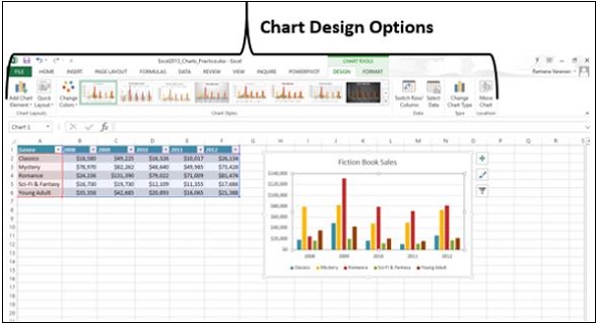
Let us understand the functions of the DESIGN tab.
Step 1 − Click on the chart.
Step 2 − Click on the DESIGN tab. The Ribbon now displays all the options of Chart Design.
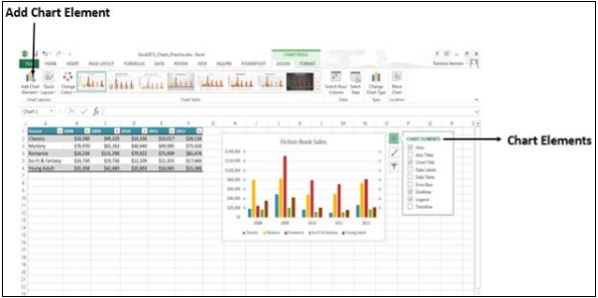
The first button on the ribbon is the Add Chart Element, which is the same as the Chart Elements, given at the upper right corner of the Charts as shown below.
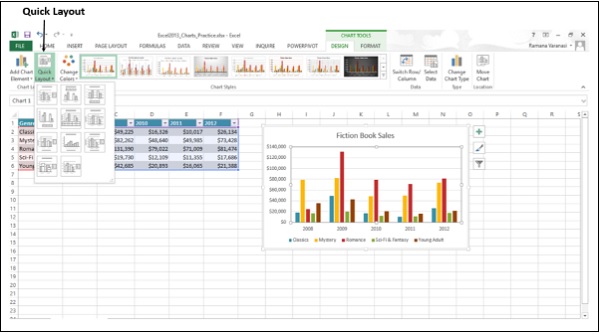
Quick Layout
You can use Quick Layout to change the overall layout of the Chart quickly by choosing one of the predefined layout options.
Step 1 − Click on Quick Layout. Different possible layouts will be displayed.
Step 2 − As you move on the layout options, the chart layout changes to that particular option. A preview of how your chart will look is shown.
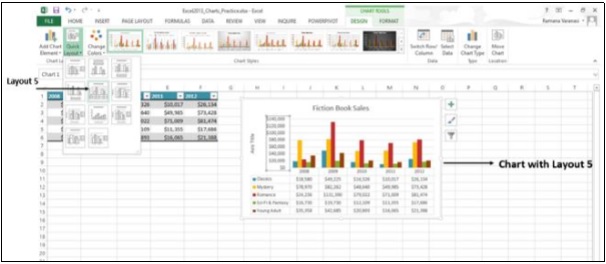
Step 3 − Click on the layout you like. The chart will be displayed with the chosen layout.
Change Colors
The Change Colors option is the same as in CHART ELEMENTS → Change Styles → COLOR.
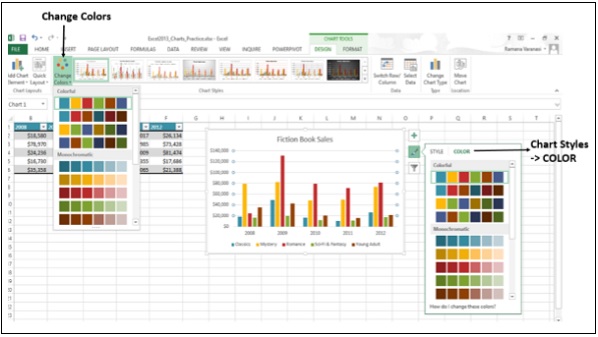
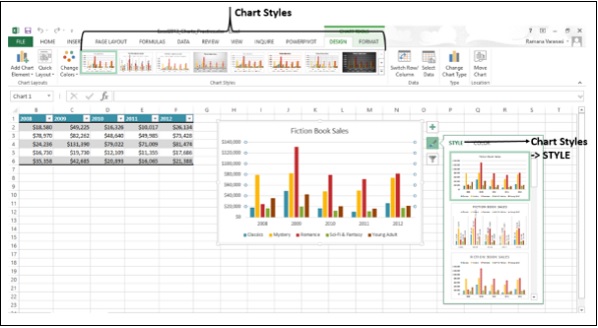
Chart Styles
The Chart Styles option is the same as in CHART ELEMENTS → Change Styles → STYLE.
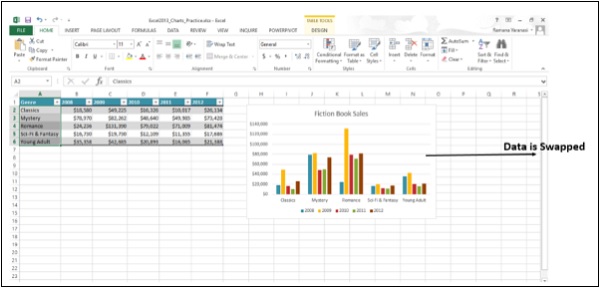
Switch Row / Column
You can use the Switch Row / Column button on the ribbon to change the display of data from X-axis to Y-axis and vice versa. Follow the steps given below to understand this.
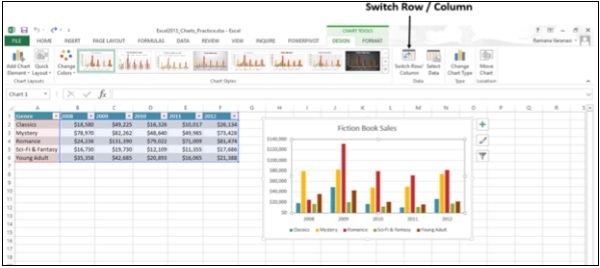
Step 1 − Click on Switch Row / Column. You can see that the data will be swapped between X-Axis and Y-Axis.
Select Data
You can change the Data Range included in the chart using this command.
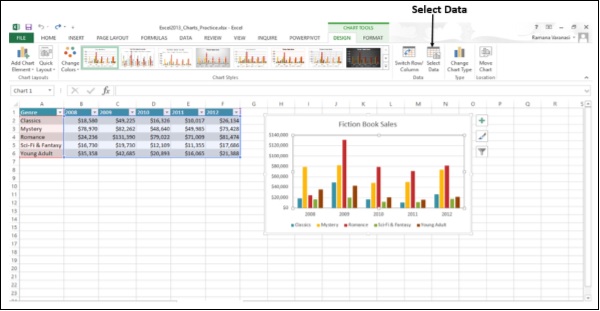
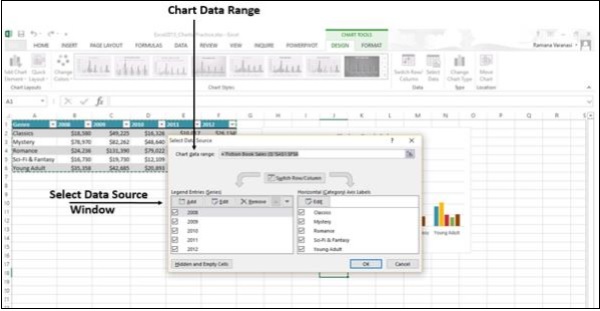
Step 1 − Click on Select Data. The Select Data Source window appears as shown in the image given below.
Step 2 − Select the Chart Data Range.
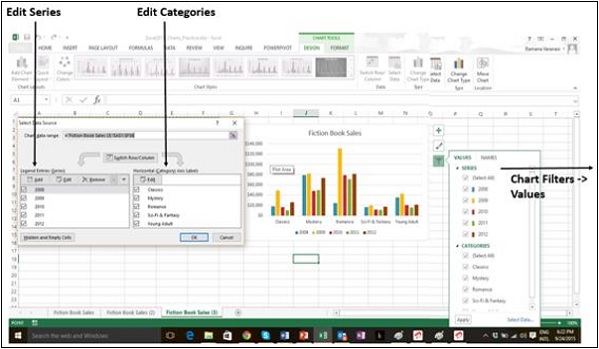
The window also has the options to edit the Legend Entries (Series) and Categories. This is the same as Chart Elements → Chart Filters → VALUES.
Change Chart Type
You can change to a different Chart Type using this option.
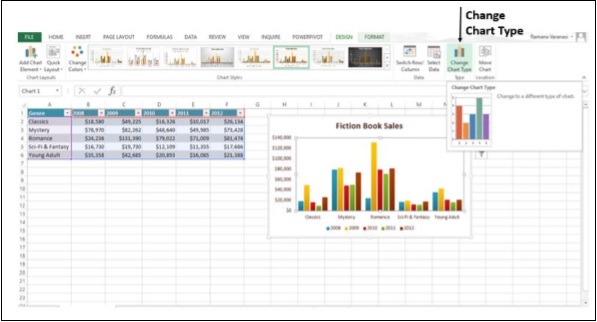
Step 1 − Click on the Change Chart Type window. The Change Chart Type window appears.
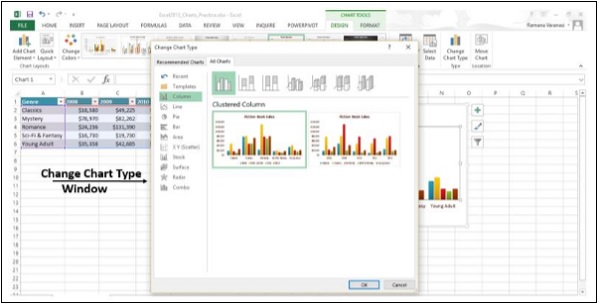
Step 2 − Select the Chart Type you want. The Chart will be displayed with the type chosen.
Move Chart
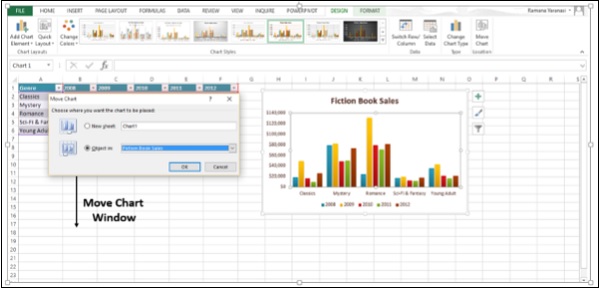
You can move the Chart to another Worksheet in the Workbook using this option.
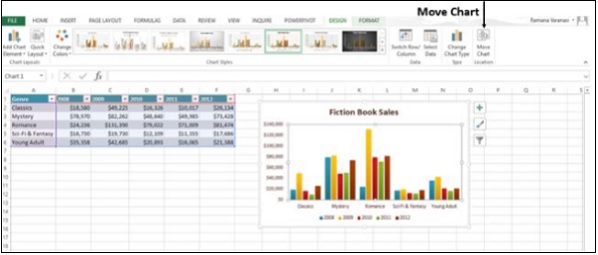
Click on Move Chart. The Move Chart window appears.
No comments:
Post a Comment