PowerPivot is an easy to use data analysis tool that can be used from within Excel. You can use PowerPivot to access and mashup data from virtually any source. You can create your own compelling reports and analytical applications, easily share insights, and collaborate with colleagues through Microsoft Excel and SharePoint.
Using PowerPivot, you can import data, create relationships, create calculated columns and measures, and add PivotTables, slicers and Pivot Charts.
Step 1 − You can use Diagram View in PowerPivot to create a relationship. To start, get some more data into your workbook. You can copy and paste data from a Web Page also. Insert a new Worksheet.
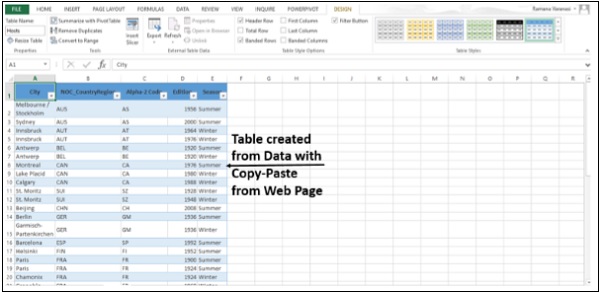
Step 2 − Copy data from the web page and paste it on the Worksheet.
Step 3 − Create a table with the data. Name the table Hosts and rename the Worksheet Hosts.
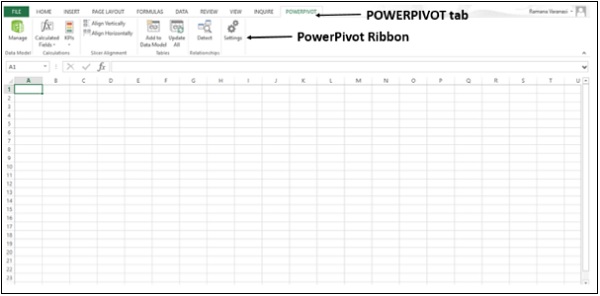
Step 4 − Click on the Worksheet Hosts. Click the POWERPIVOT tab on the Ribbon.
Step 5 − In the Tables group, click on Add to Data Model.
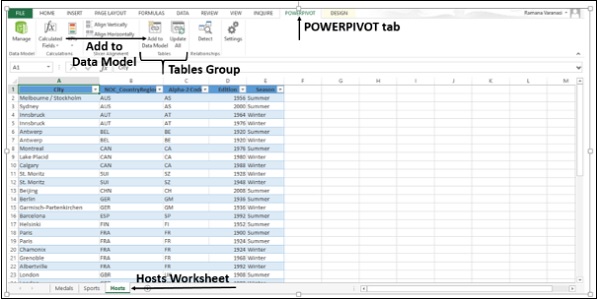
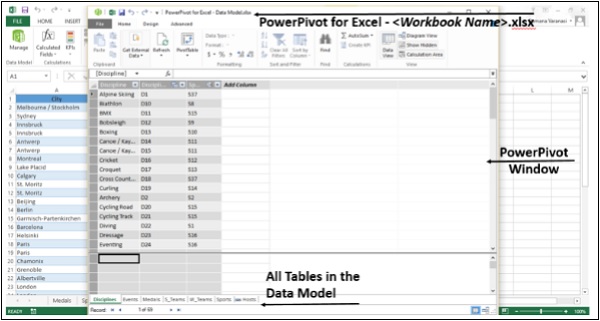
Hosts Table gets added to the Data Model in the Workbook. The PowerPivot window opens.
You will find all the Tables in the Data Model in the PowerPivot, though some of them are not present in the Worksheets in the Workbook.
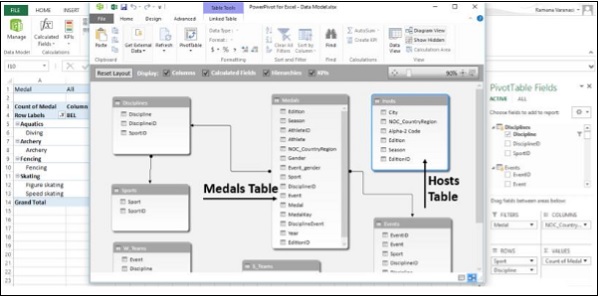
Step 6 − In PowerPivot window, in View group, click on Diagram View.
Step 7 − Use the slide bar to resize the diagram so that you can see all tables in the diagram.
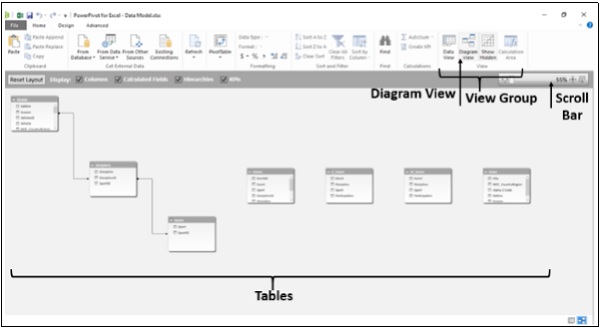
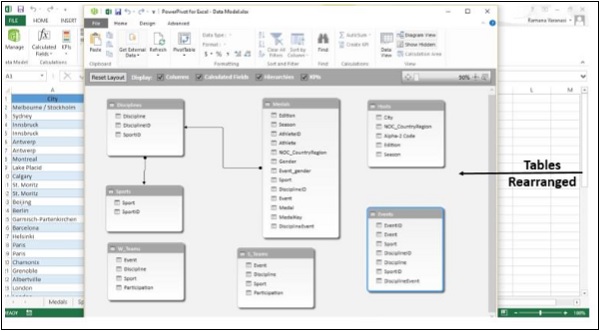
Step 8 − Rearrange the tables by dragging their title bar, so that they are visible and positioned next to one another.
Four tables Hosts, Events, W_Teams, and S_Teams are unrelated to the rest of the tables −
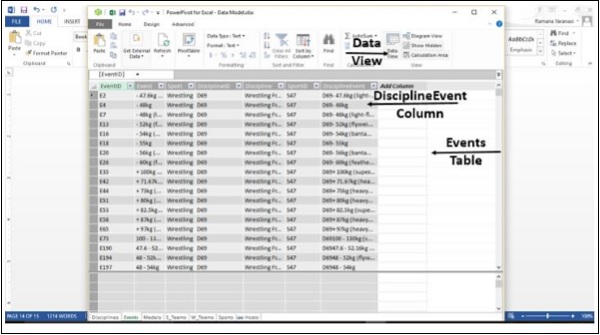
Step 9 − Both, the Medals table and the Events table have a field called DisciplineEvent. Also, DisciplineEvent column in the Events table consists of unique, non-repeated values. Click on Data View in Views Group. Check DisciplineEvent column in the Events table.
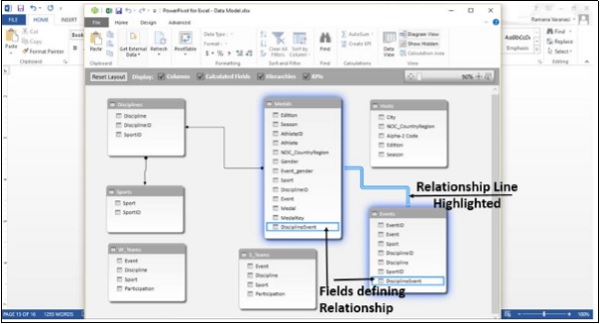
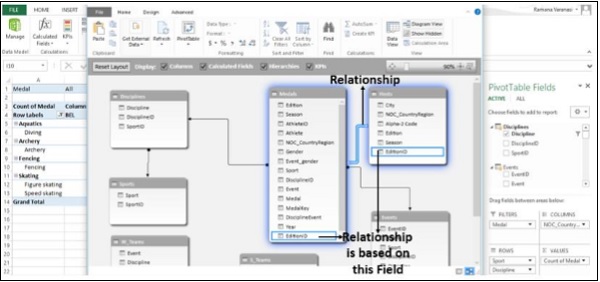
Step 10 − Once again, click on Diagram View. Click on the field Discipline Event in the Events table and drag it to the field DisciplineEvent in the Medals Table. A line appears between the Events Table and the Medals Table, indicating a relationship has been established.
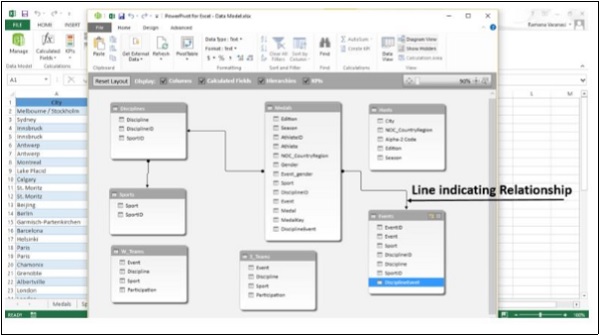
Step 11 − Click on the line. The line and the fields defining the relationship between the two tables are highlighted as shown in the image given below.
Data Model using Calculated Columns
Hosts table is still not connected to any of the other Tables. To do so, a field with values that uniquely identify each row in the Hosts table is to be found first. Then, search the Data Model to see if that same data exists in another table. This can be done in Data View.
Step 1 − Shift to Data View. There are two ways of doing this.
- Click on Data View in the View group.
- Click on the Grid button on Task Bar.
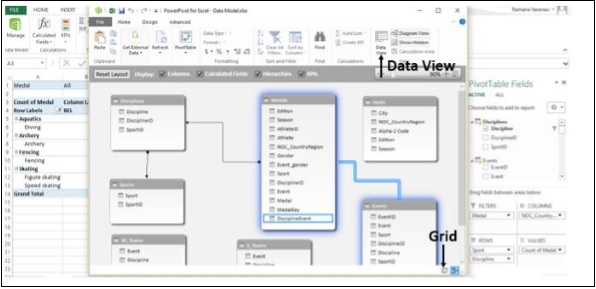
The Data View appears.
Step 2 − Click on the Hosts table.
Step 3 − Check the data in Hosts Table to see if there is a field with unique values.
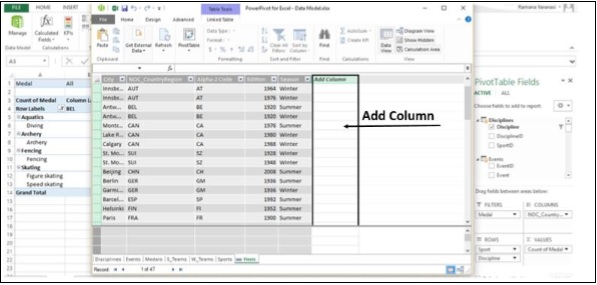
There is no such field in Hosts Table. You cannot edit or delete existing data using PowerPivot. However, you can create new columns by using calculated fields based on the existing data. In PowerPivot, you can use Data Analysis Expressions (DAX) to create calculations.
Adjacent to the existing columns is an empty column titled Add Column. PowerPivot provides that column as a placeholder.
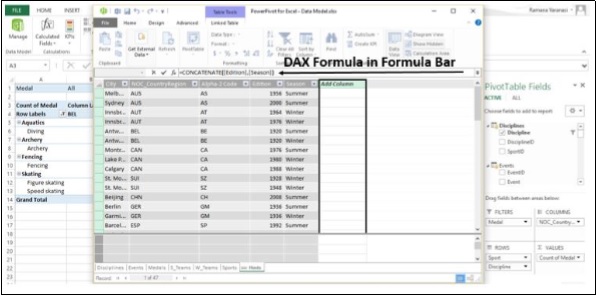
Step 4 − In the formula bar, type the DAX formula −
= CONCATENATE([Edition],[Season])
Press Enter. The Add Column is filled with values. Check the values to verify that they are unique across the rows.
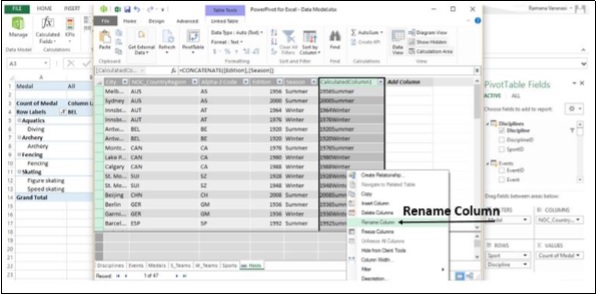
Step 5 − The newly created column with created values is named CreatedColumn1. To change the name of the column, select the column, right-click on it.
Step 6 − Click on the option Rename Column.
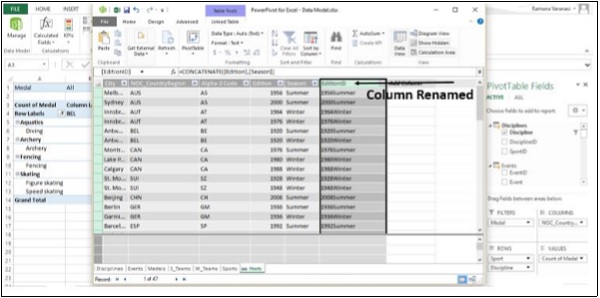
Step 7 − Rename the column as EditionID.
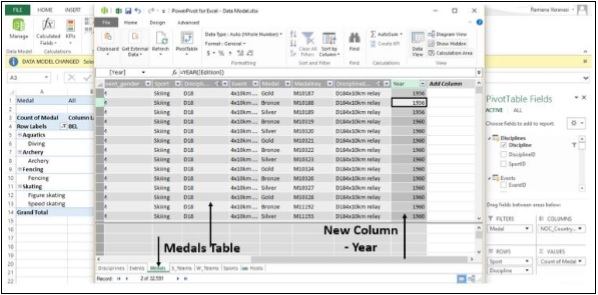
Step 8 − Now, Select the Medals Table.
Step 9 − Select Add Column.
Step 10 − In the Formula Bar, type the DAX Formula,
= YEAR ([EDITION])
and press Enter.
Step 11 − Rename the Column as Year.
Step 12 − Select Add Column.
Step 13 − Type in the Formula Bar,
= CONCATENATE ([Year], [Season])
A new column with values similar to those in the EditionID column in Hosts Table gets created.
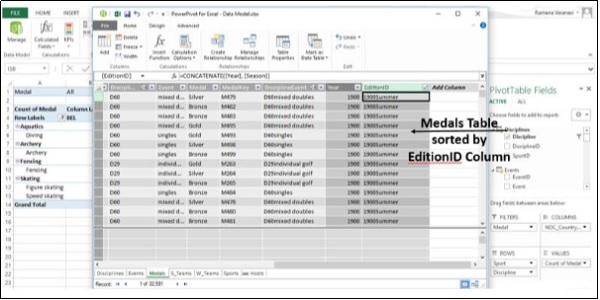
Step 14 − Rename the column as EditionID.
Step 15 − Sort the Column in Ascending Order.
Relationship using calculated columns
Step 1 − Switch to Diagram View. Ensure that the tables Medals and Hosts are close to each other.
Step 2 − Drag the EditionID column in Medals to the EditionID column in Hosts.
PowerPivot creates a relationship between the two tables. A line between the two tables, indicates the relationship. The EditionID Field in both the tables is highlighted indicating that the relationship is based on the column EditionID.
No comments:
Post a Comment